Dashboard
Your command center for the entire print farm. The dashboard gives you a real-time financial overview, fleet status, and production metrics at a glance.
Overview
The dashboard is the first page you see when you open Daedalus. It aggregates data from across the platform into a single view so you can understand the health of your business without clicking through multiple pages.
Key Features
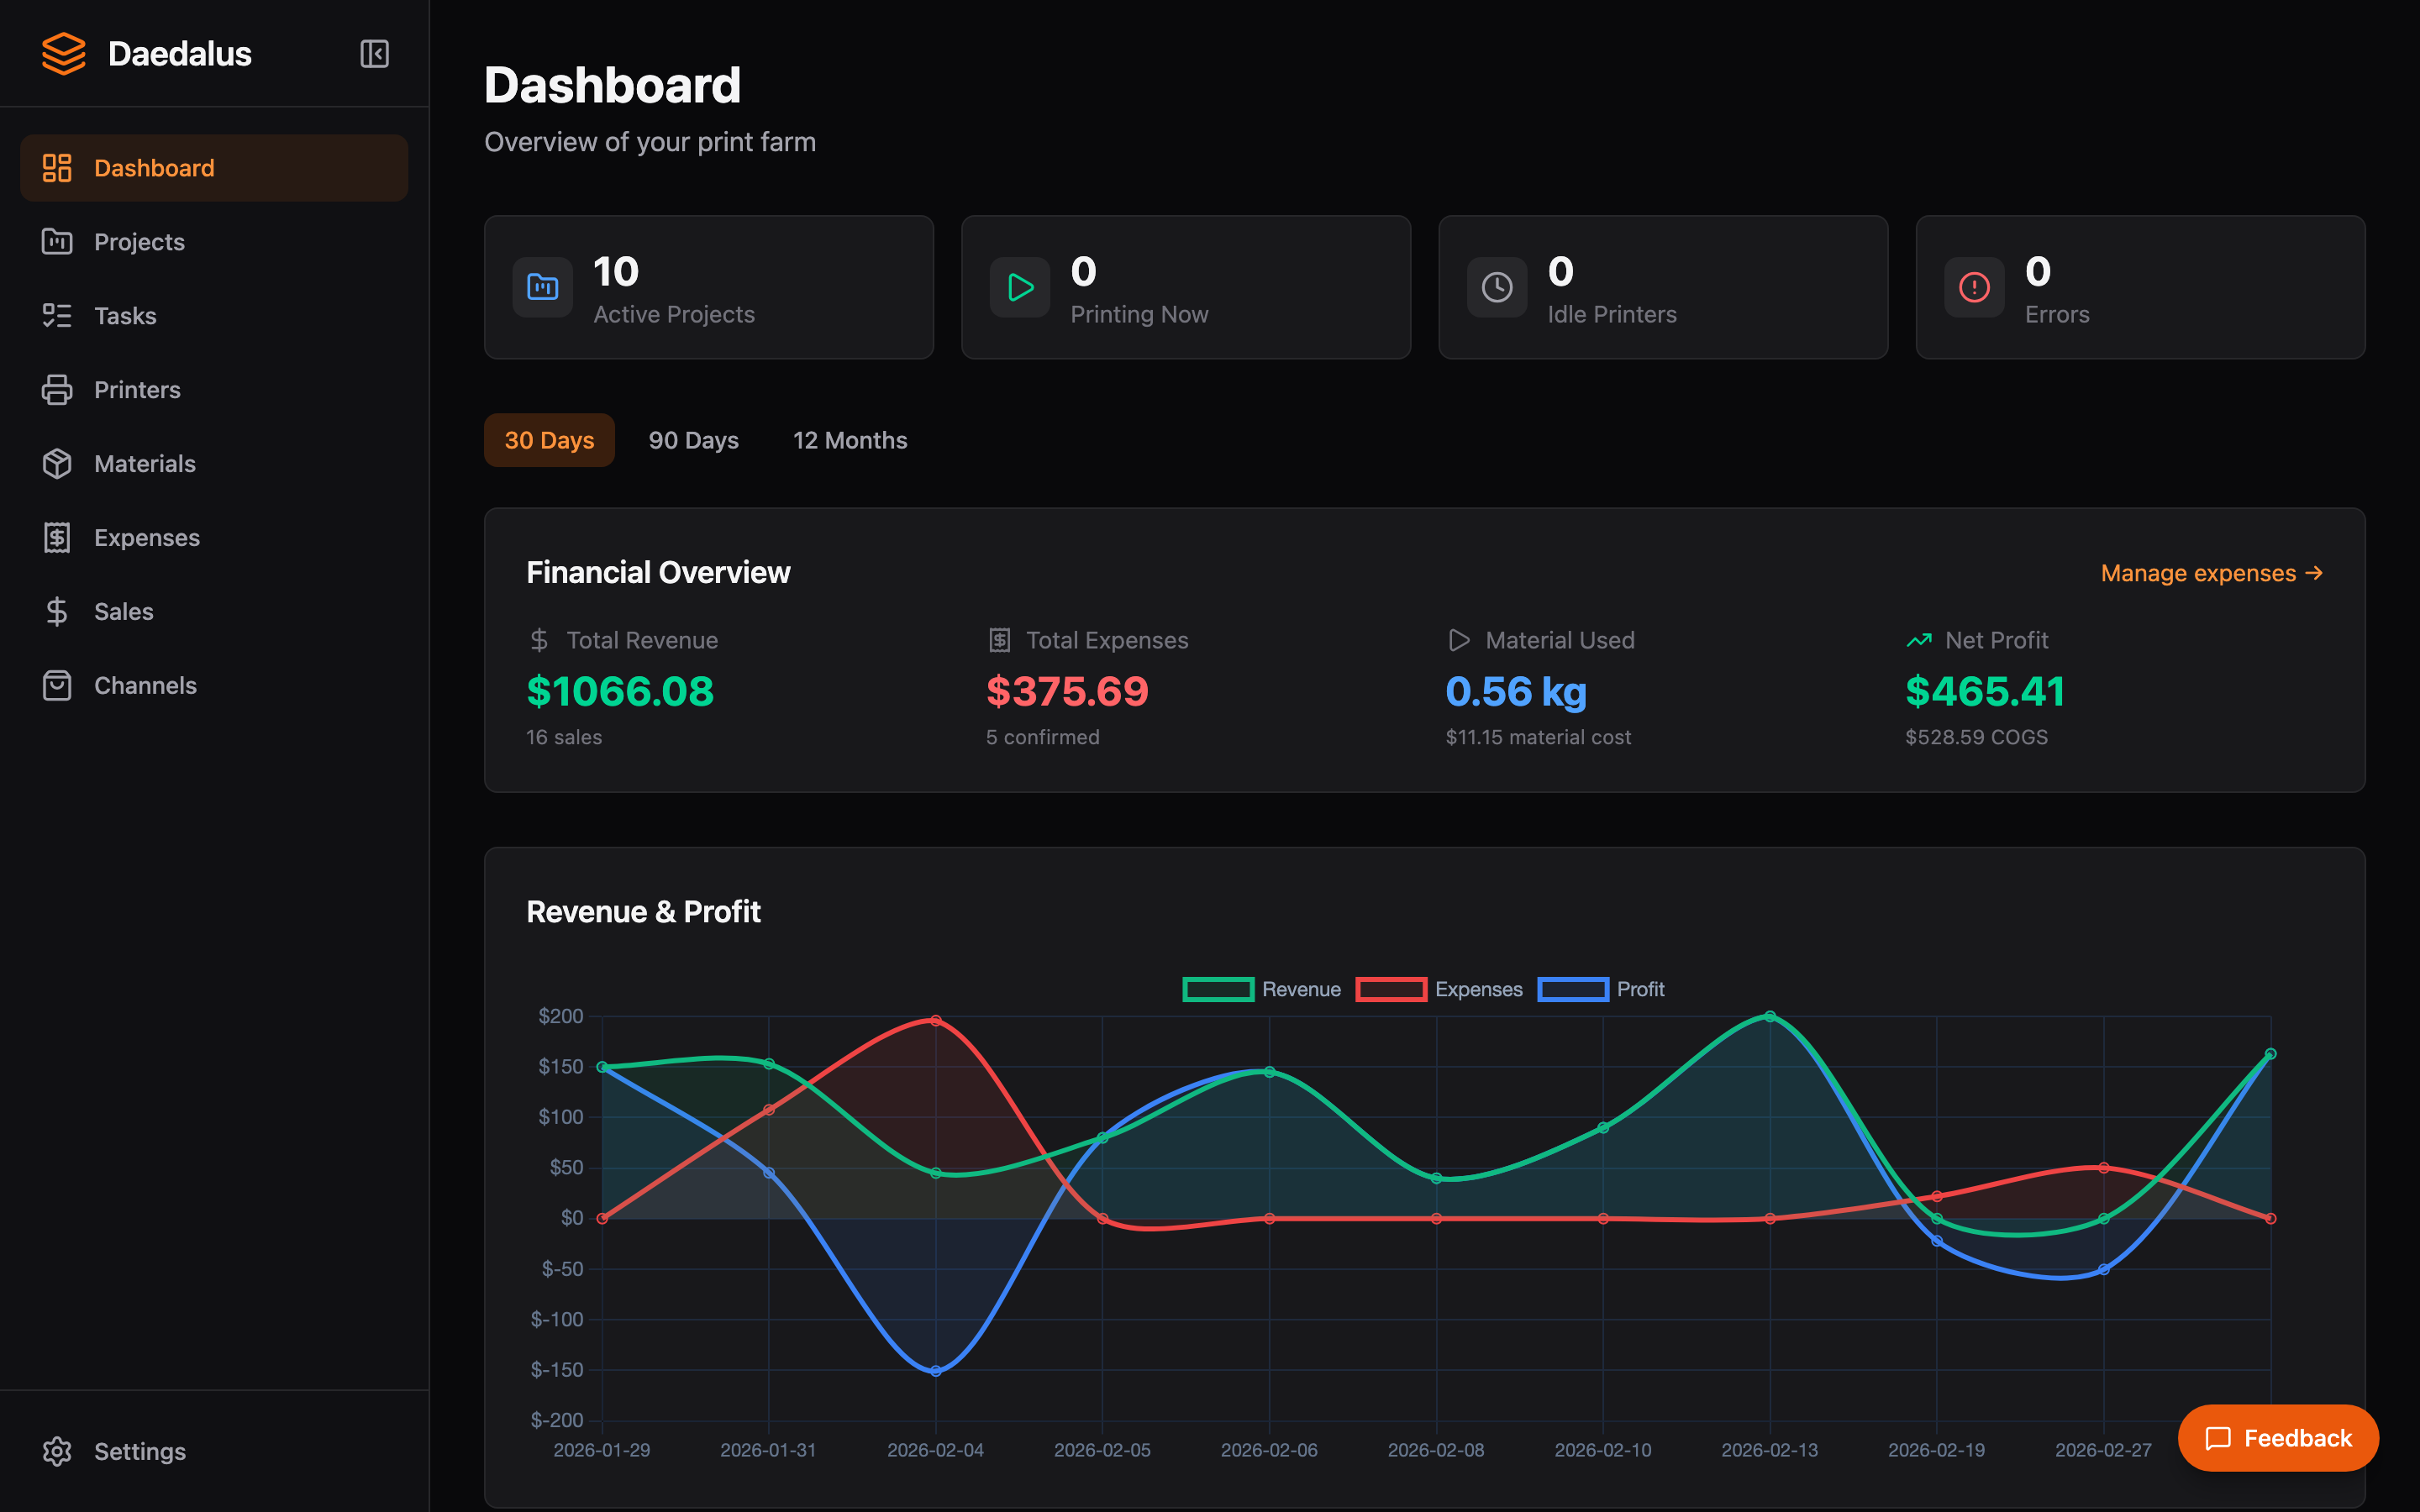
Stats Cards
The top row shows key financial metrics for the selected time period:
- Total Revenue — Sum of all recorded sales
- Total Expenses — Sum of all tracked expenses across all categories
- Net Profit — Revenue minus expenses
- Gross Margin — Profit as a percentage of revenue
Revenue Chart
A time-series chart showing revenue trends over the selected period. Hover over data points to see exact figures for each day or week.
Fleet Panel
A compact overview of all connected printers showing:
- Printer name and model
- Current status (idle, printing, error, offline)
- Active job progress percentage
- Nozzle and bed temperatures for connected printers
Recent Activity
A feed of recent events across the platform including completed print jobs, new orders, and status changes.
Tip: The dashboard updates in real-time via WebSocket. You don't need to refresh the page to see new data — printer status, job progress, and order counts update automatically.