Sales & Analytics
Understand where your money comes from and where it goes. Built-in analytics show revenue trends, per-project profitability, and channel breakdowns.
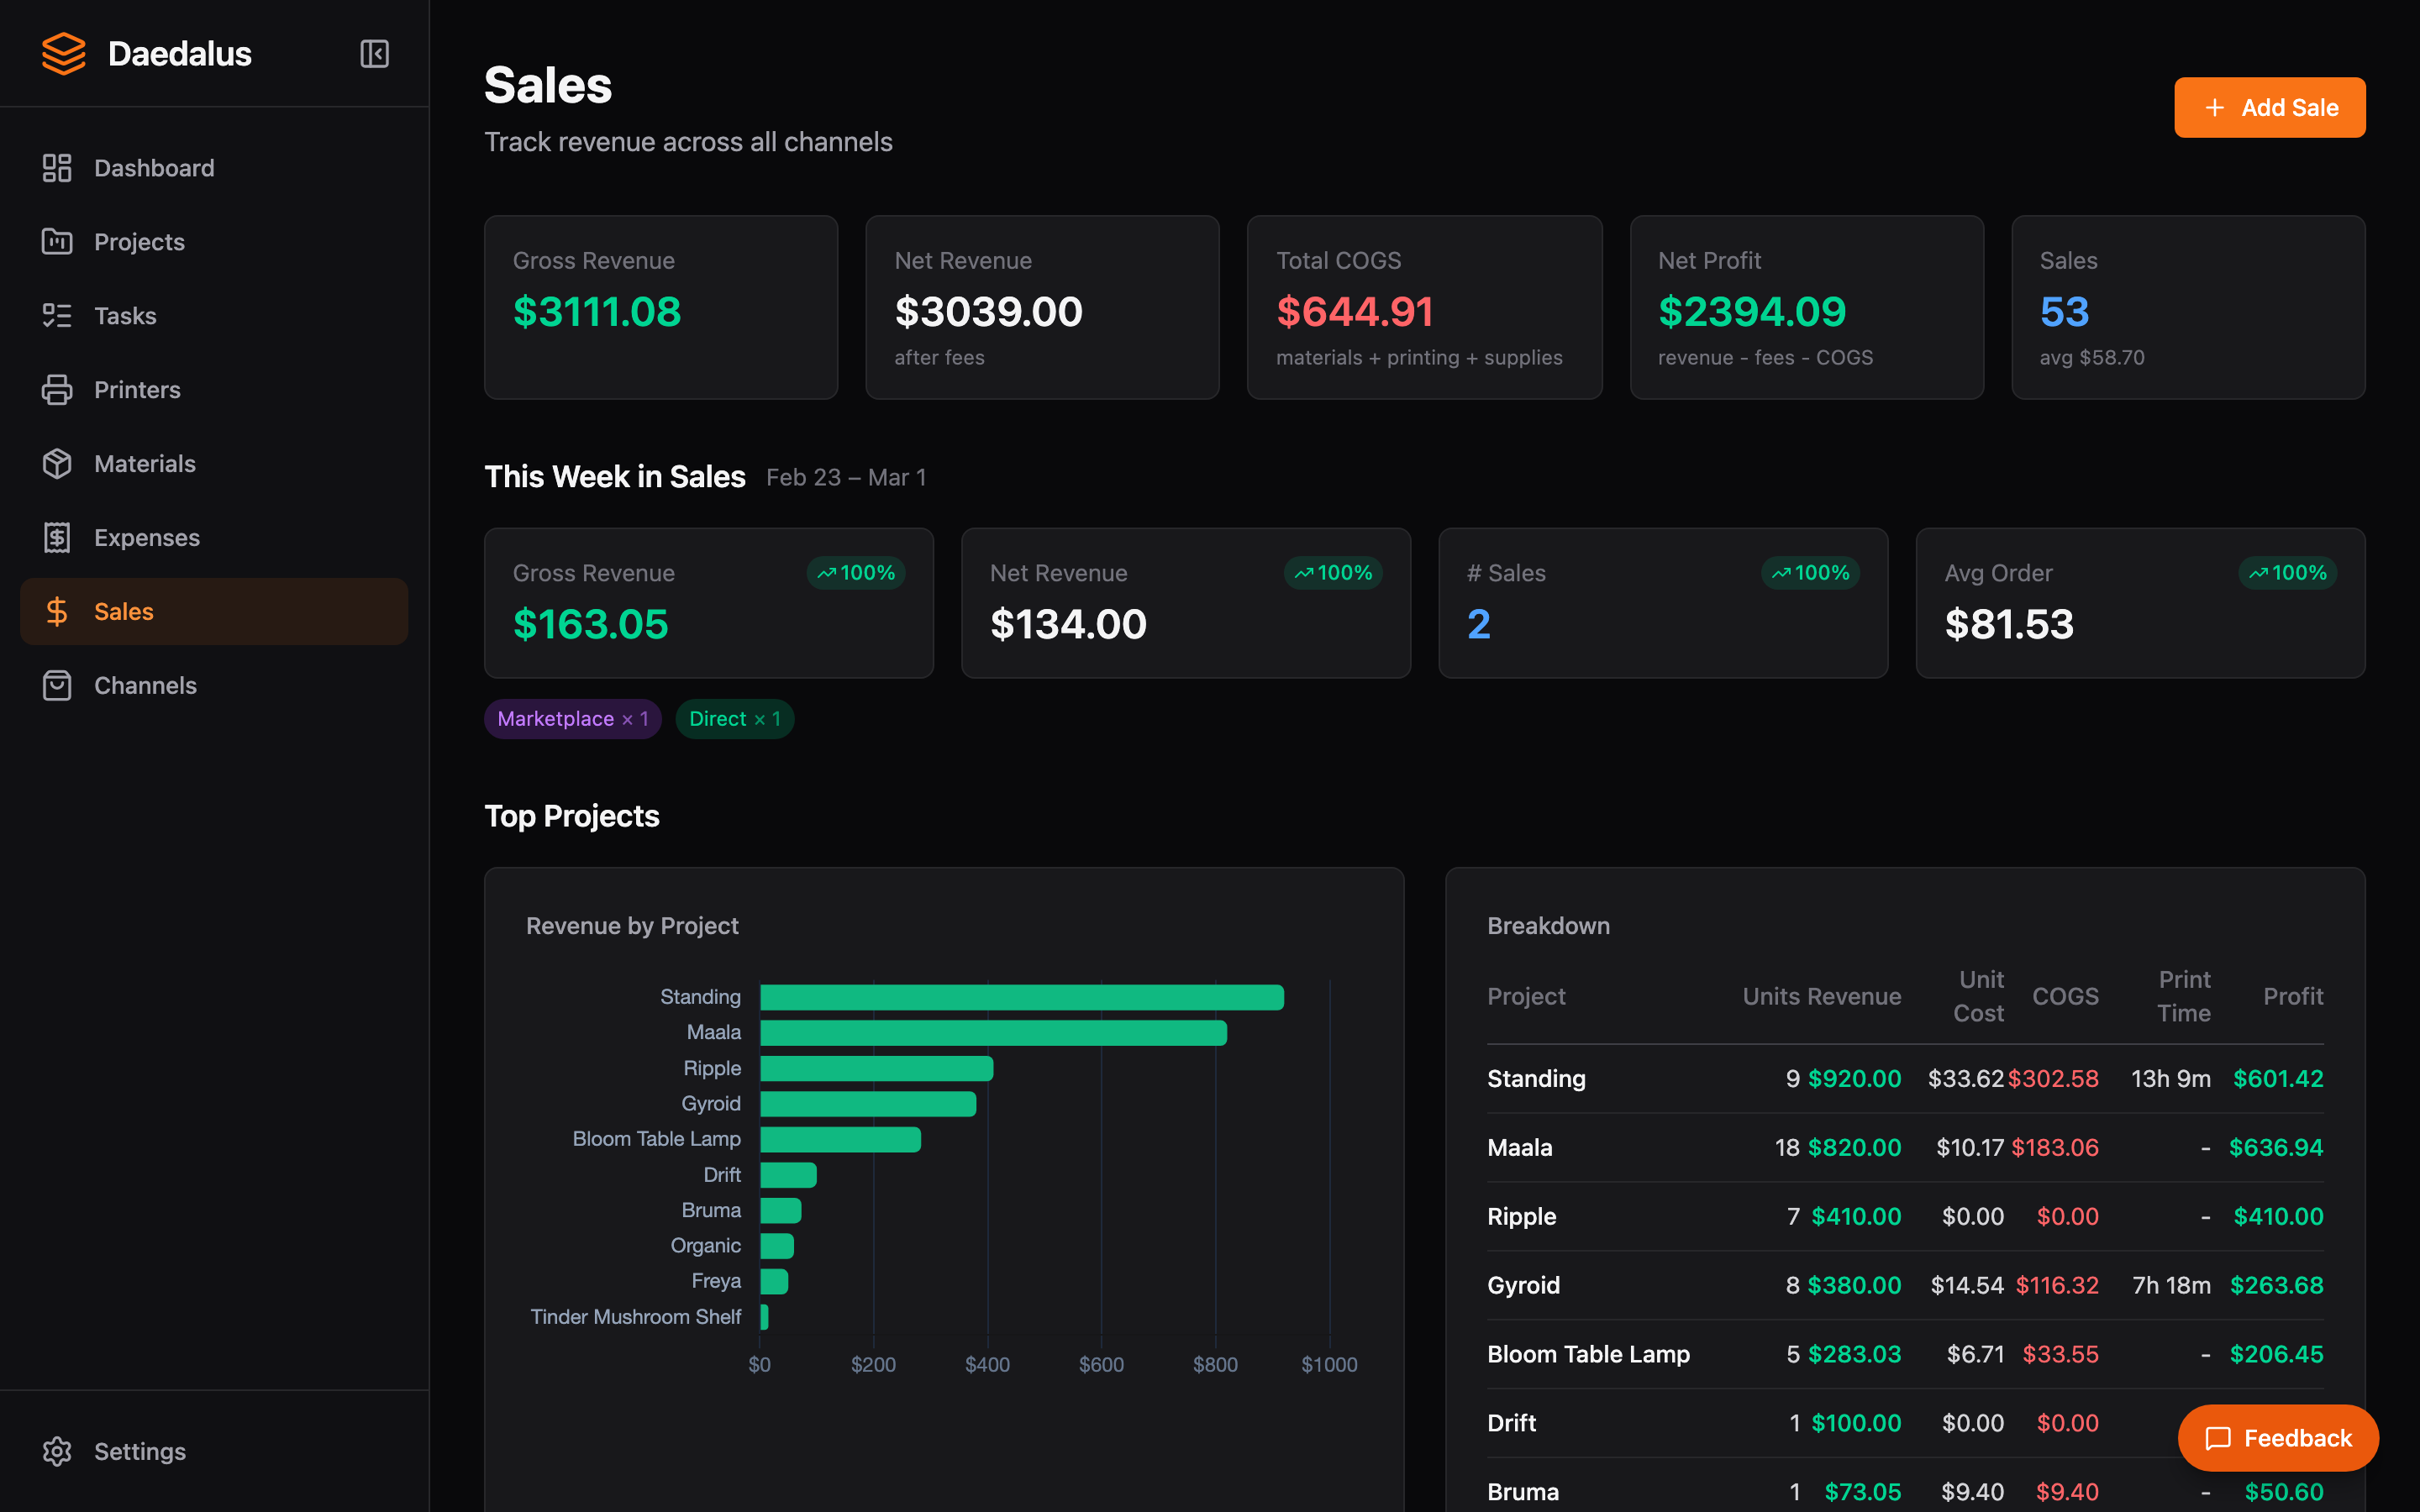
Overview
The Sales page combines recorded sales data with expense tracking to give you a complete financial picture. View revenue over time, drill down by project or channel, and identify your most profitable products.
Key Features
Recording Sales
Sales are recorded automatically when orders from connected channels are marked as shipped. You can also record manual sales:
- Click Record Sale
- Optionally link to a project and/or customer
- Enter the item description, quantity, and sale price
- Choose the sales channel (or “Direct” for non-marketplace sales)
- The sale is added to your analytics immediately
Customer Linking
When recording a sale, you can select a customer from the dropdown to associate the revenue with a specific buyer. Selecting a customer auto-fills the customer name. For one-off sales without a customer record, leave the dropdown empty and type a name in the text field instead. See Customers for more on managing customer records.
Weekly Insights
Daedalus generates weekly insight summaries showing:
- Total revenue and comparison to previous week
- Top-selling products by quantity and revenue
- Channel performance comparison
- Notable trends or anomalies
Project Profitability
For each project, Daedalus calculates:
- Revenue — Total sales for this project
- Material cost — Filament and supplies used per unit
- Print time cost — Based on configured hourly rate
- Marketplace fees — Transaction and listing fees
- Profit per unit — Revenue minus all costs
- Profit per hour — Helps optimize your product mix
Channel Breakdown
See how each sales channel performs:
- Revenue by channel (Etsy, Shopify, Squarespace, Direct)
- Order volume and average order value per channel
- Fee comparison across marketplaces
- Trends over time for each channel
Revenue Charts
Time-series charts with configurable date ranges:
- Daily, weekly, or monthly aggregation
- Revenue and profit overlay
- Filter by project or channel
- Hover for exact values on any data point